Psychogeographic survey of Pittsburgh 15206
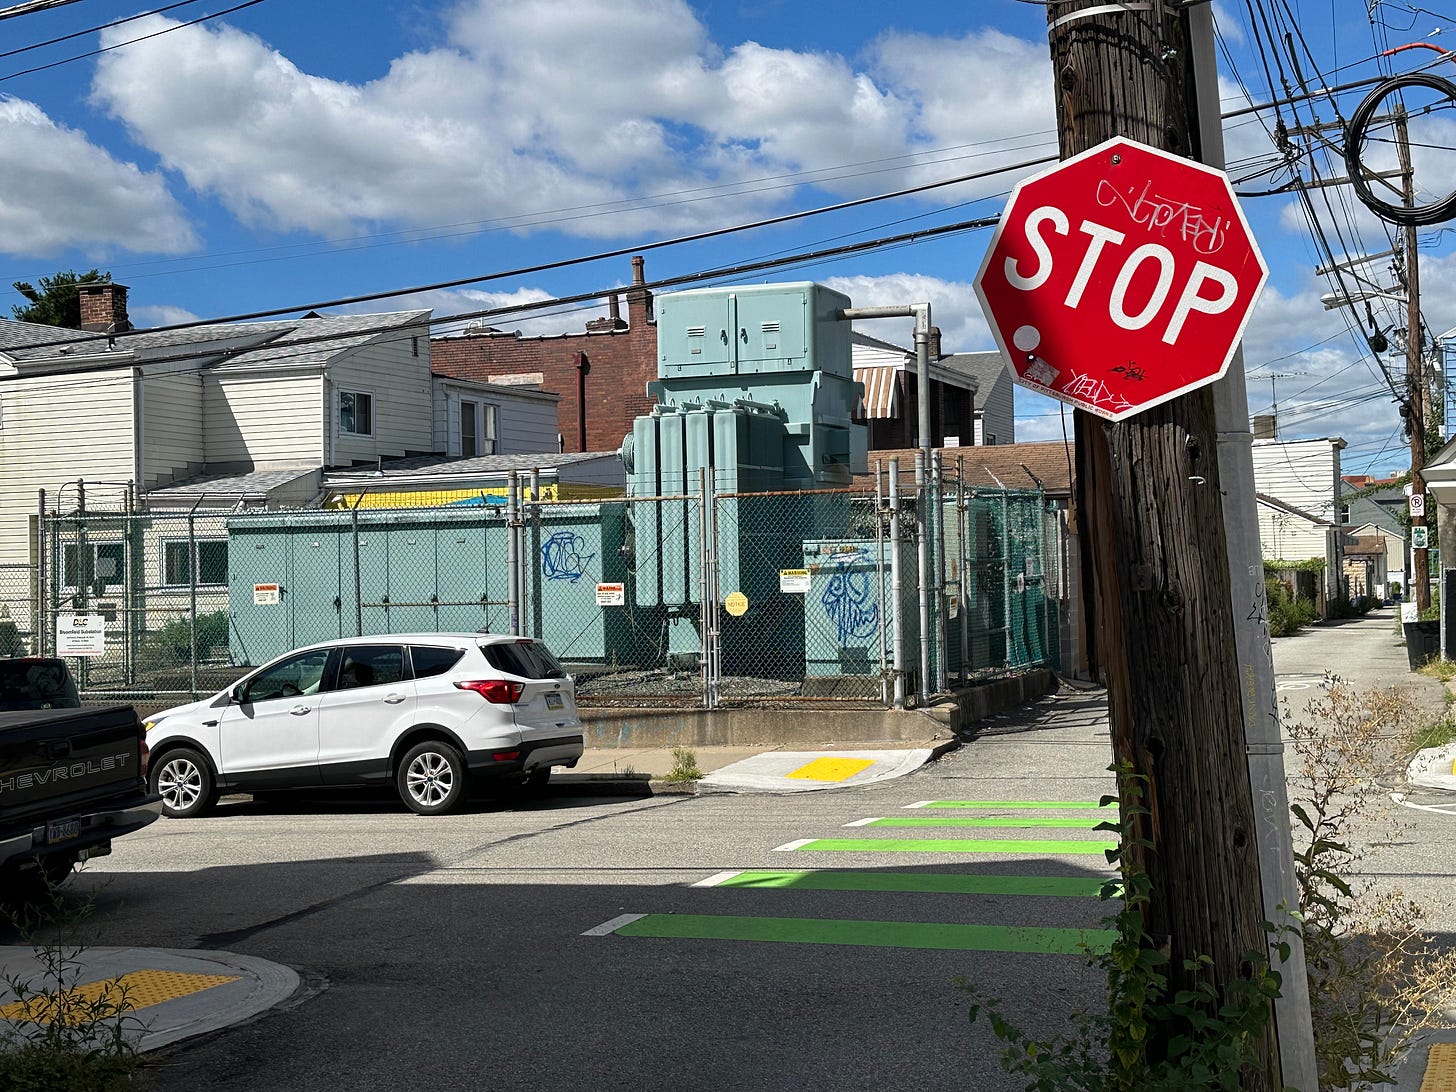
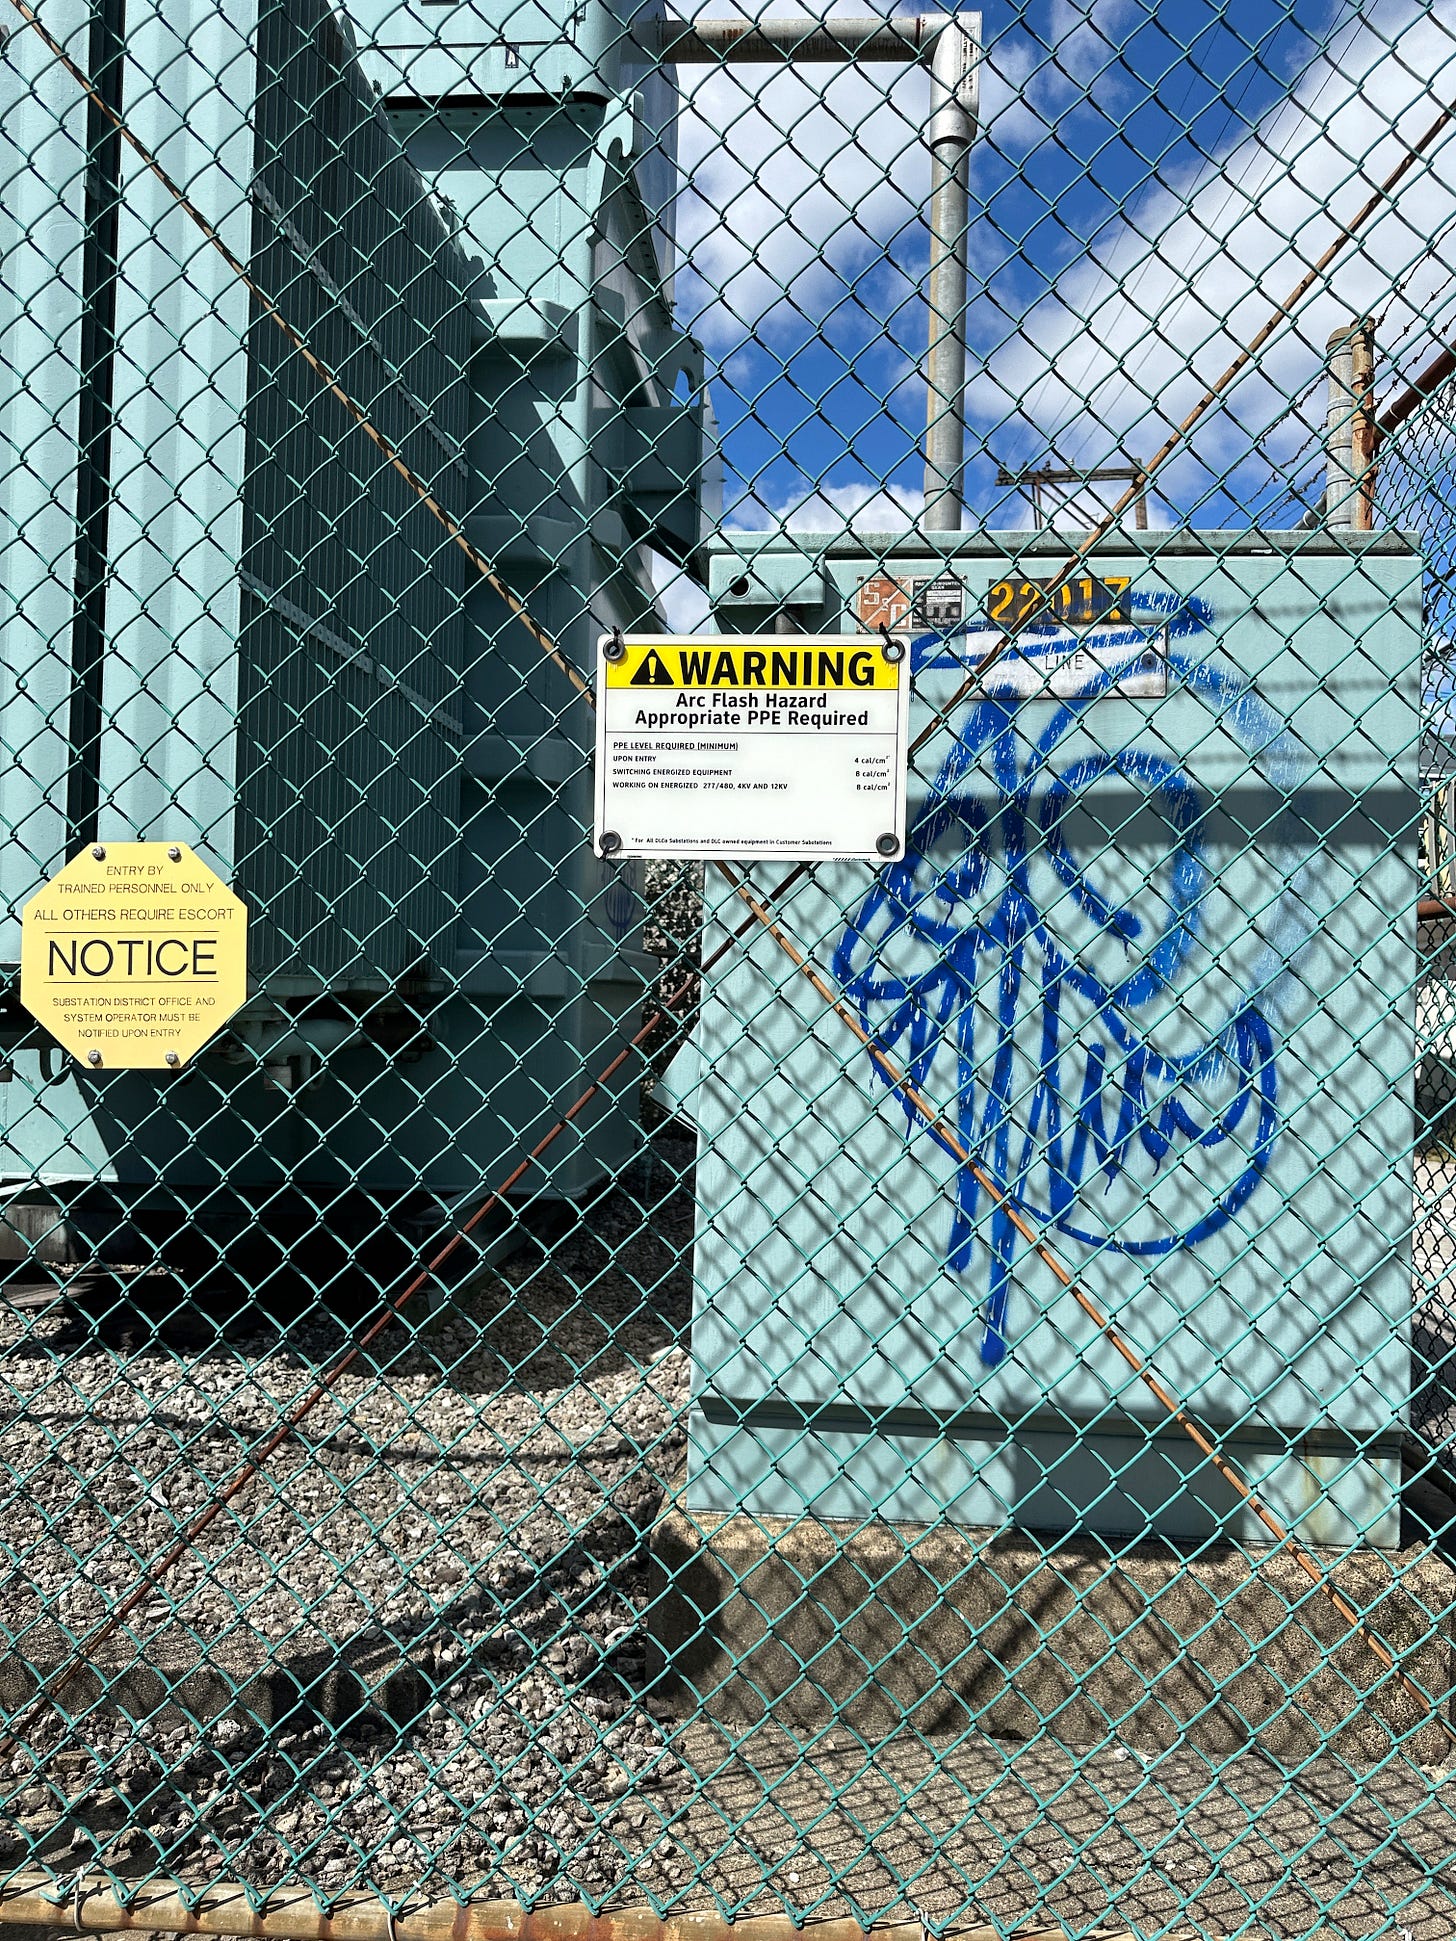
An electromagnetic survey of the Bloomfield substation at Comrie and Pearl.
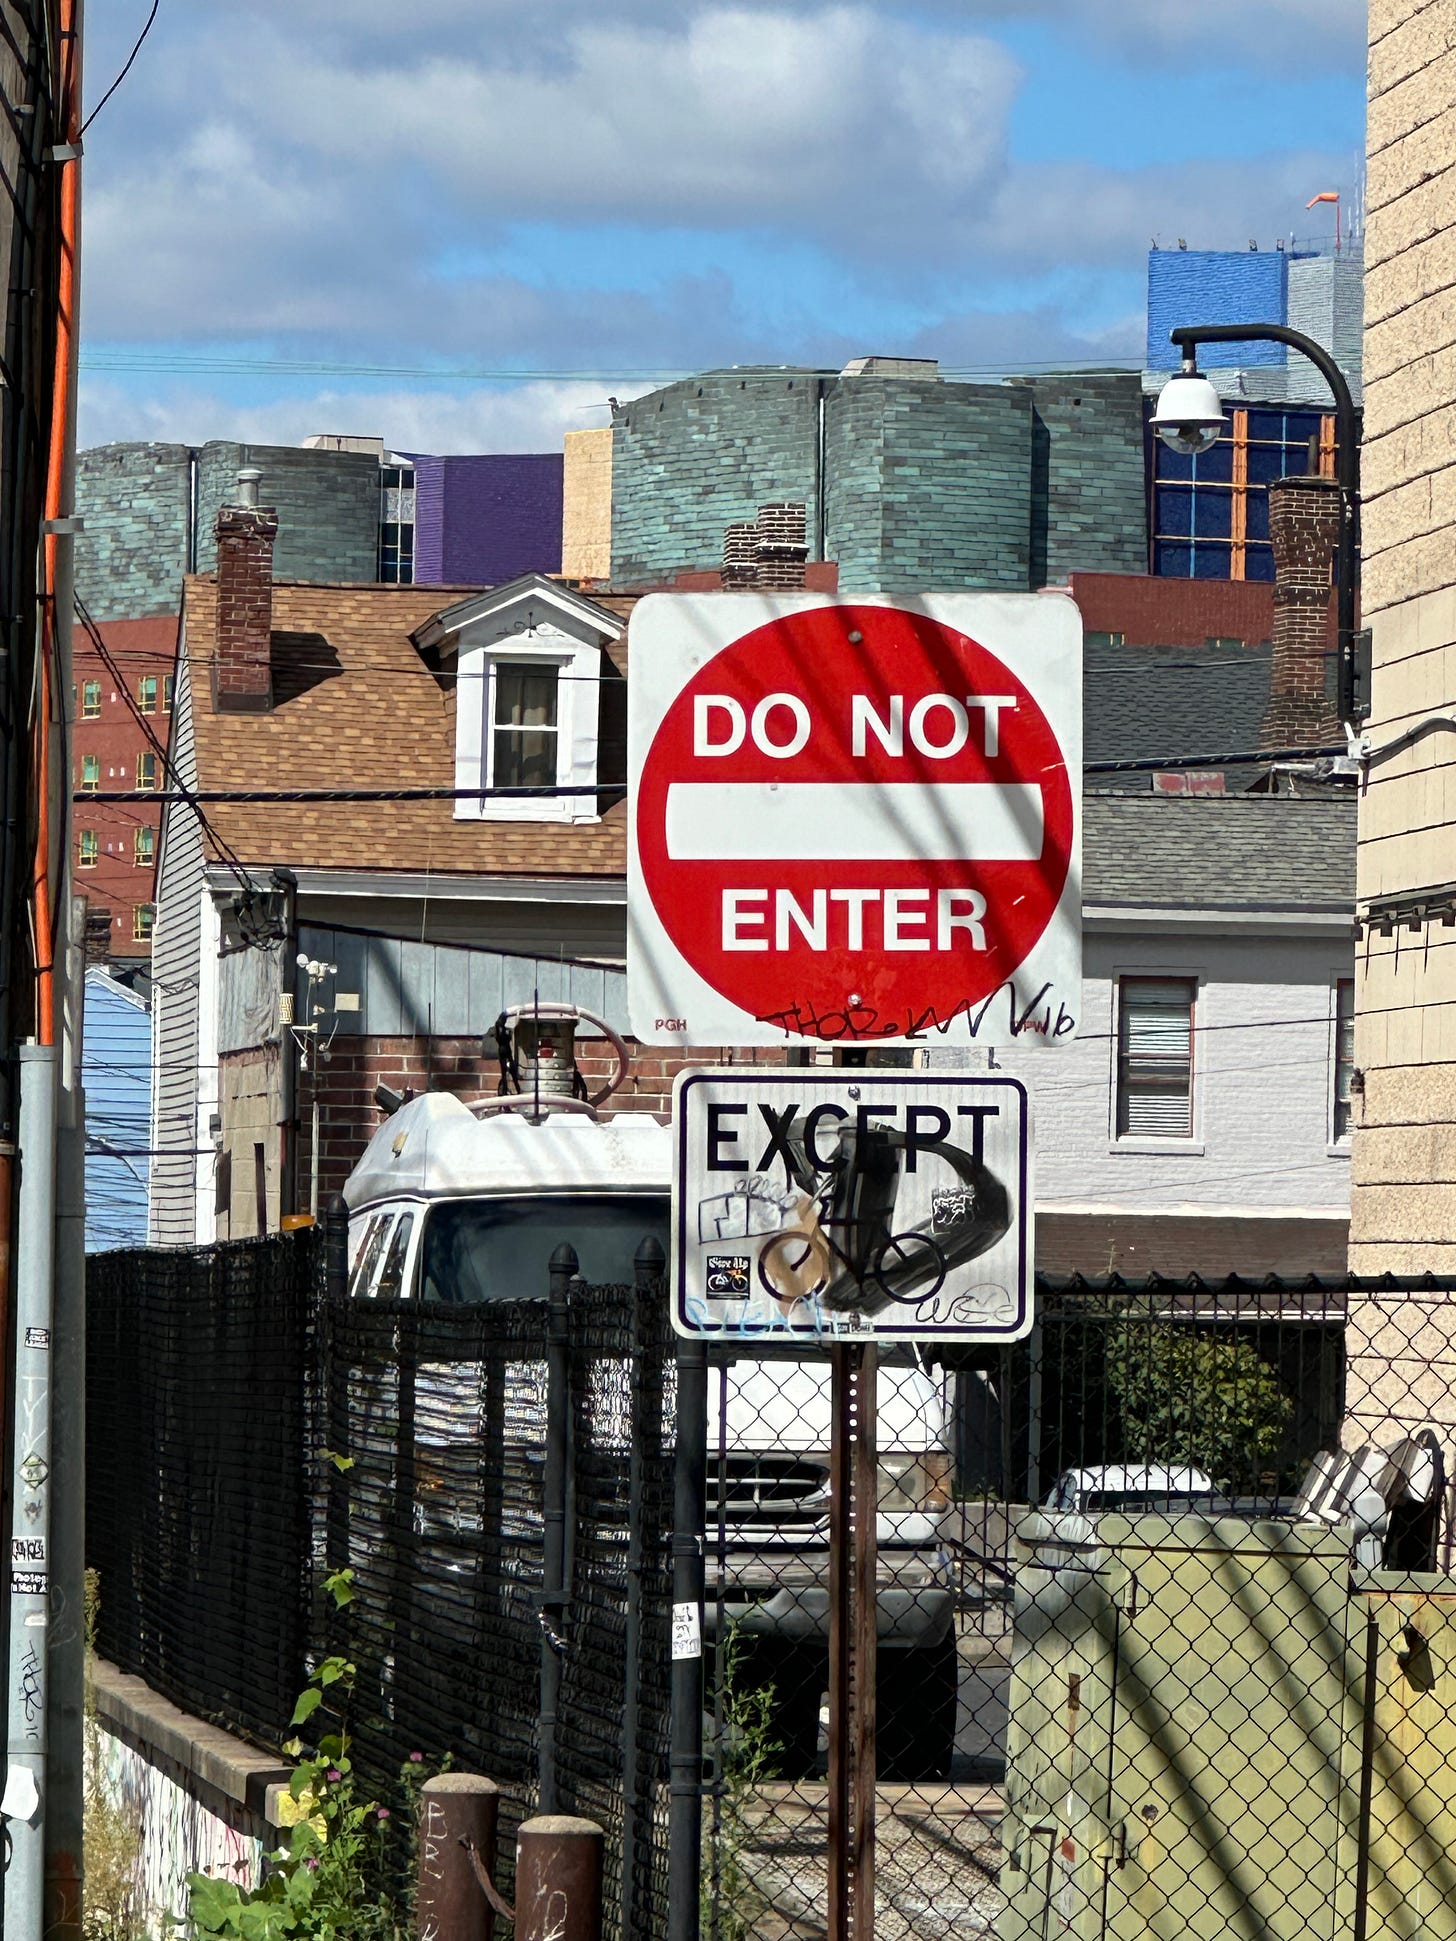
Most weekday mornings before I go to work but after I’ve sat meditation I take my two dogs out for a walk. We turn down Coral street cross Winebiddle street at the Waldorf school and keep going down Comrie until it hits the intersection of Penn and Friendship.
That’s our turnaround and we say hello to the nurses parking in the alley who work at Children’s hospital, just across the street. The hospital building is a patchwork of incongruous plastic blues and washed out grey tiling, a post-modern design mess close-up but from a distance those panels capture placid-grey or startling blue, an open space in the center of the building straight through to the backdrop of the sky.
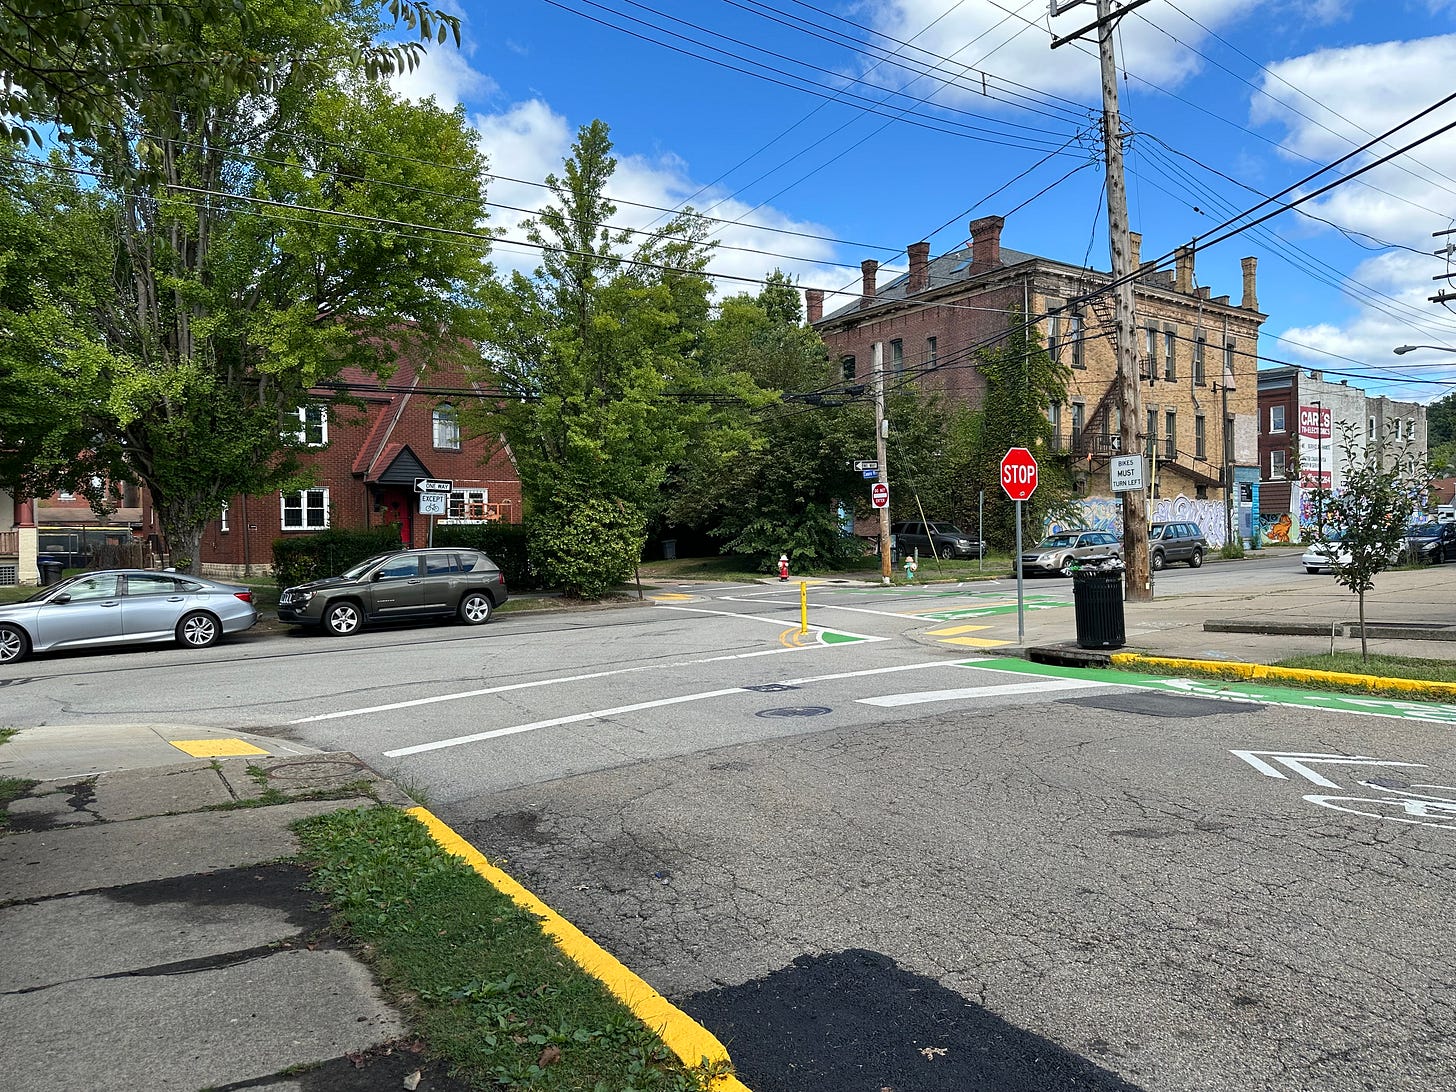
About halfway from Winebiddle to the end at the intersection of Comrie and Pearl is the Bloomfield substation. I am an archivist of hidden phenomenon. A poet of electromagnetic activity. Last week on Sunday I took my Very Low Frequency receiver and recorded the electromagnetic hum.
A substation is the part of the electrical grid that takes high voltage current and steps it down into voltage that can be used by households.
Power lines and electrical devices in cities generate extremely low-frequency (ELF) EMFs, typically in the range of 50-60 Hz. The lowest pitch on a piano is 27.5 Hz (an A). The highest pitch is 4186 Hz ( a very high C). Middle C is 261 Hz and of course the tuning reference A is at 440Hz (pace those enthusiasts who would have us tune A to 432, with undoubted universal resonance and healing). Keep in mind that the piano refers to vibration of air hitting our ear drums and interpreted as pitch. We don’t have ears to hear electromagnetism, which is why when I go on these psychogeographical surveys I carry with me a Very Low Frequency receiver plugged in to a Zoom recorder.
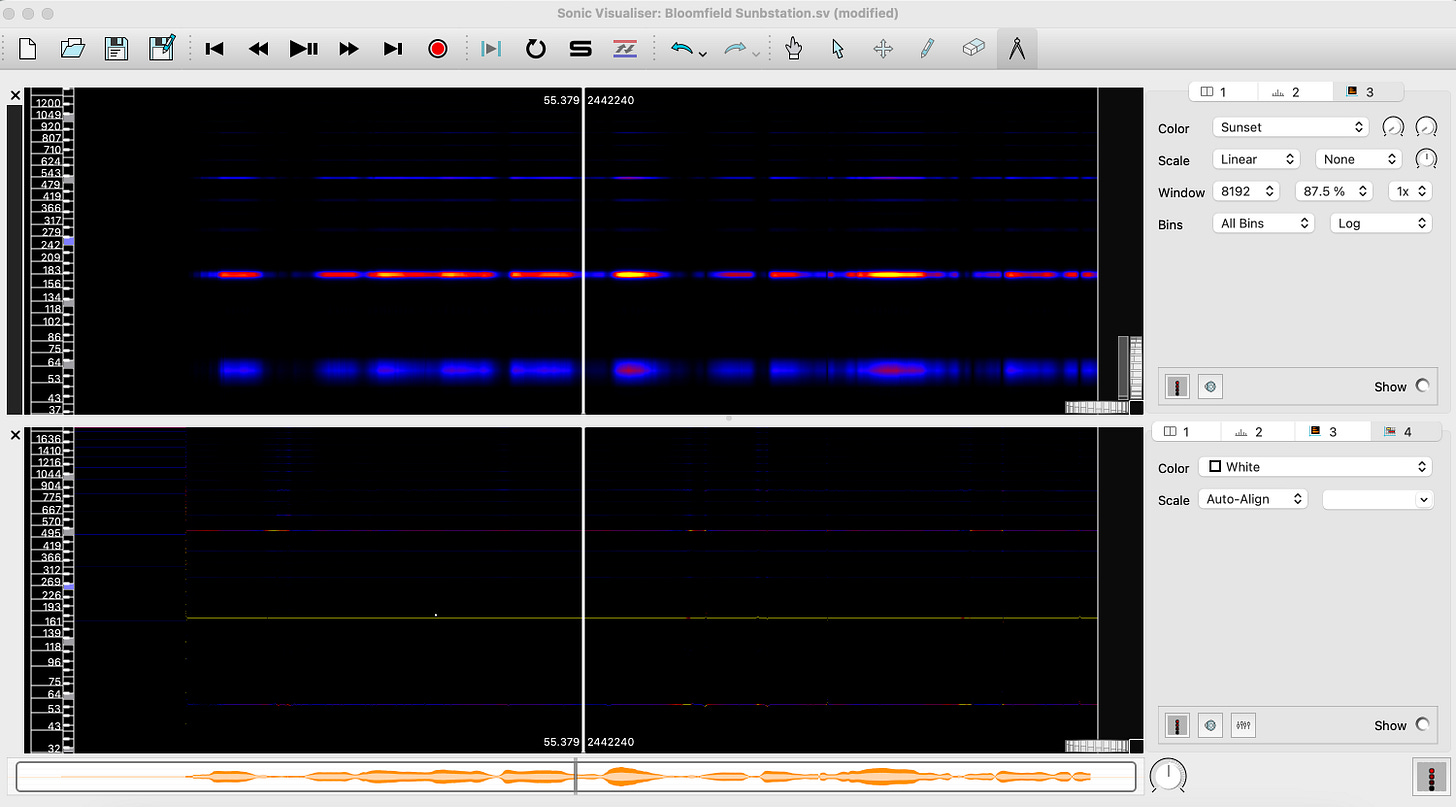
SPECTROGRAM
A spectrogram is a visual representation of Frequency changing over Time. Fast Fourier Transform (FFT) takes a snapshot of overtones in a slice of time. The granularity of both those measurements will change the visual. This image shows an analysis of the recorded sound from the Bloomfield substation, about two minutes of recording. I’ve set the analysis so it really highlights the three strongest frequencies which I will shorthand as 64HZ, 183HZ and 543HZ. I can play that on the piano 64 Hz is closest to A2 (65.41 Hz), 183 Hz is closest to D#3 (185.00 Hz) 543 Hz is closest to A#5 (554.37 Hz).
The electric grid is a thing of extraordinary beauty, a poetic landscape to explore. The hum on Penn avenue outside my house is a complex drone that I’ve used in my composition. These lines are like our modern ley lines, yes?


